Monday, February 13, 2017

A Brief Anatomy of Gold Bull Markets

A Brief Anatomy of Gold Bull Markets


It's Déjà vu all over again: Gold prices and gold stocks are up again! Many market participants who missed the gigantic move of mining stocks last year may think that the spike in mining shares this year is real and want to take advantage of this joyful bandwagon. However, this gold upward move could still be cyclical in a secular bear market. Unlike last year, most gold/silver stocks seem to hesitate to join the gold/silver parade, reflecting the investors' doubt about the stamina of this rebound, even though political or economic uncertainty looms.
For a start, let's first look at the returns of some top gold/silver stocks in 2016. Last year, from the low points to the peaks in August, most gold/silver stock prices doubled or tripled, with some jumping even more than that:
  • Northern Dynasty Minerals (NAK) up 1625% from $0.20 to $3.45, now $2.90;
  • First Majestic Silver (AG) soared 798% from $2.4 to $19.15, now $10.75;
  • Sibanye Gold (SBGLrose 423% from $3.95 to $20.68, now $8.86;
  • Pan American Silver (PAAS) ascended 300% from $5.36 to $21.56, now $21.08;
  • Royal Gold (RGLD) climbed 258% from $24.33 to $87.16, now $70.70; ...
These heavenly metal shares advanced so quickly that many investors simply missed the rally. How did this rebound happen? In retrospect, we know it just recouped some lost land due to negative over-reaction to the Federal Reserve's hawkish comments on interest rate policy. In 2016, the Fed raised the federal fund rates only once rather than three times as anticipated by many market players in the early of the year.
Now the Federal Reserve seems to being playing a similar game as last year, believing that it is proper to hike interest rates three or four times this year. But the market thinks otherwise, as federal fund rate futures imply two instance of interest rate hikes on the horizon. This may be the main catalyst to drive gold prices up 10% so far, although the fear of inflation, geopolitics or temporary softness of the US dollar may also partially contribute to the recent gold price climb.

Two Secular Gold Bull Markets

Unlike other commodities, whose prices are determined by supply and demand, Gold is a political metal. Its price can fluctuate due to factors like geopolitics, inflation/deflation, currency movements, monetary policy, and supply and demand. During the past 50 years, gold/silver prices experienced two secular bull markets (Chart 1 and Chart 2):

1. The Gold Bull Market From 1971 To 1980

On August 15, 1971, President Richard Nixon astonished the world by abandoning the Bretton Wood Agreement, which fixed the US dollar to gold and the rest of the world's currencies to the dollar. This Nixon shock devalued the US dollar, thereafter letting it freely float against gold and other currencies, and officially terminated the gold standard.
From the gold low price of $38 a troy ounce in August 1971 to $672 a troy ounce on September 8, 1980, the price of gold rose 1668%. In this gold bull market, the price of gold had two major upward movements driven by geopolitics, inflation, and monetary policy.
  1. From the bottom price $38 in 1971 to the peak $195 on December 30, 1974, the price of gold climbed 410%, then fell back to $113 on August 10, 1976, dropping 42%. This gold bull resulted primarily from President Nixon's twice devaluations of US dollar and Arab oil embargo, which sent the price of oil from $2.95/barrel to $11.65/barrel, leading to towering inflation in the mid-1970s. The average annual inflation rate during this period was 6.2%, from a low of 3.22% in 1972 to a high of 11.04% in 1974 (see chart 3). After an Arab oil embargo, the pace of inflation accelerated from 6.22% in 1973 to 11.04% in 1974, and so did the price of gold.
  2. From the lowest price of $113 on August 10, 1976, after a slumber for nearly two years, gold prices advanced again to $672 on September 8, 1980, rising 494%. The major events in this period included the Iranian revolution and Iran-Iraq war. After the Iranian revolution in 1979 and Iran-Iraq War in 1980, oil production in Iran almost stopped and Iraq's oil production also declined dramatically. This oil crisis caused oil prices to more-than double to $39.5 a barrel in one year. The average inflation for six years was 9%, far higher than the long-term average 3.2%. The advance in gold price corresponded to the skyrocketing inflation rate: 5.76% in 1976; 6.5% in 1977;7.59% in 1978; 11.35% in 1979; and 13.5% in 1980 (See charts 3 and 4).
To fight hyperinflation, Paul Volcker, then-chairman of the Federal Reserve, boldly raised interest rates to 19.1% in 1981 from 4.68% in 1977. The federal fund rates moved in tandem with inflation rates (see chart 5). Mr. Volcker's courage saved the economy in the face of near unanimous denunciation and derision.

2. The Gold Bull Market From 2001 To 2011

After twenty years of doldrums, gold began to rally in late 2001. A stock market multi-year low, the 9-11 terror attack, and the Iraq War became the vital events for this fledgling gold price rise. From a low of $272 in November 2001 to $1806 in September 2011, the price of gold advanced 560%.
Interestingly, this gold bull also ran two major stages. (1). From a low of $272 in November 2001 to $959 in July 2008, gold prices moved up 252%, then retreated 25% as the Global Financial Crisis worsened in latter 2008 (See Chart 1). Dramatic demand for gold by hedge funds surfaced in 2001 as the US would run a record trade and budget deficit. China's overall industrialization took off in 2002, providing the pivotal catalyst for the super bulls in metal and oil prices.
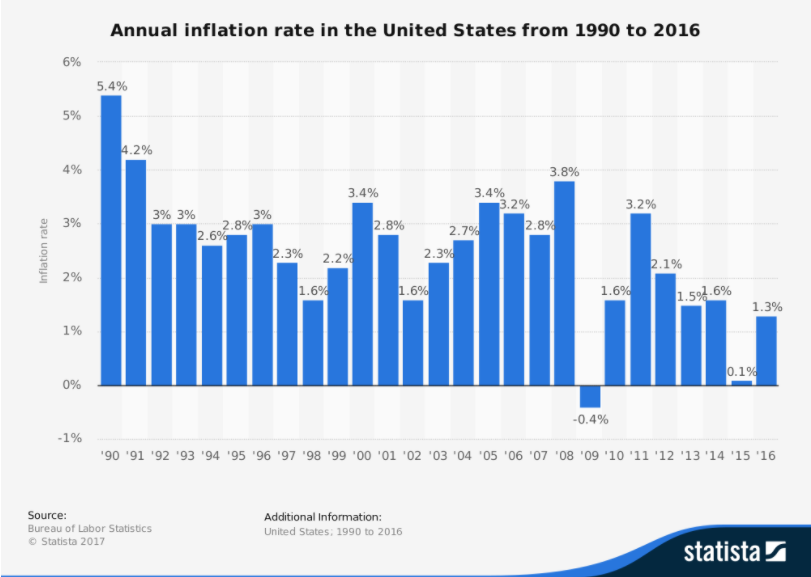
During this period, the inflation rate slowly budged up from 1.6% in 2002 to 3.8% in 2008, while interest rates kept moving down from 6% in 2001 to 1% in May 2004, then sped up to 5.25% in August 2006 as the Federal Reserve looked likely to be behind the yield curve (See Chart 6). This shows that gold prices did move in sync with the inflation rate, but randomly shifted with interest rates during this period. (2). From the low of $712 in November 2008 to $1806 in November 2011, gold prices mounted 153%.
After the financial crisis, global central banks adopted quantitative easing policy to prime the pump. By flooding the financial system with money, central bank pushed down interest rates, while encouraging inflation. Interest rates dropped to 0.1% from 5% in August 2007, and the inflation rate climbed back to 3.2% from -0.4% in 2009, then gradually drifted down afterward (See Chart 6).

Implication for Current Gold Rally

Since then, the price of gold has rebounded 10%. It is too early to tell if this 10% rally is the incipient of the third secular gold bull market. Based on twenty years of time lapse between the first and second gold bull markets, the current gold secular bear market should have further to go. Present markets are still full of gold bulls and need more time to exhaust hope for gold.
It is premature to conjecture that Trump's fiscal policy will fan the inflation flame. Like Reagan, who did not cut taxes until two years after he was inaugurated, Trump may also delay his tax cut for all sorts of reasons. Although the Reagan era did create a huge deficit, gold prices did not grow into another powerful bull leg.
Technically, during the twenty years of gold price sluggishness between two secular bull markets, there were five cyclical bull runs: (1).+ 57% (June 29, 1982 to January 18, 1983---6.5 months); (2). +44% ( June 24, 1986 to December 15,1987 ---18 months); (3).+15% ( September 21, 1989 to February 19, 1990--- 5 months); (4).+16% (March 31, 1993 to July 9 1993 --- 3.3 months); (5). +20%( August 15, 1999 to October 4, 1999--1.6 months).
The average rallied about 30% in nearly 7 months. Current gold price is engaging on the second upturn. The first rebounded 24.5% from December 4, 2015 to August 1, 2016, spanning 8 months. So the second rally can last 4 to 5 months longer or shorter with upside 8% more/less if factored into twenty years of previous gold bear market.
Silver bull markets could follow gold bull markets due to its similar chart pattern with gold price. If the above analysis is correct, gold/silver price could still be in the early inning of secular bear markets, and current rallies in gold/silver prices can be interpreted as cyclical rebound in long-term down trend or bottom building. The US dollar could be strengthening further in the foreseeable future, given its inverse relationship with gold prices. However, investors can still selectively participate in the cyclical gold/silver recovery.
------------------
The article was originally published on www.equities.com. I am grateful for senior editor Daniel Banas' outstanding edit. He polished the article in great detail. I also acknowledged the insight on metal sector from John Bell ---a metal specialist investor whose portfolio returned 170% in 2016. This is just a personal opinion, and personal opinion is often wrong. Currently, the author has no position on any of the above mentioned stocks, and may or may not build any position on any stocks above in the future.

Chart 1. Gold Prices From 1973 to 2017
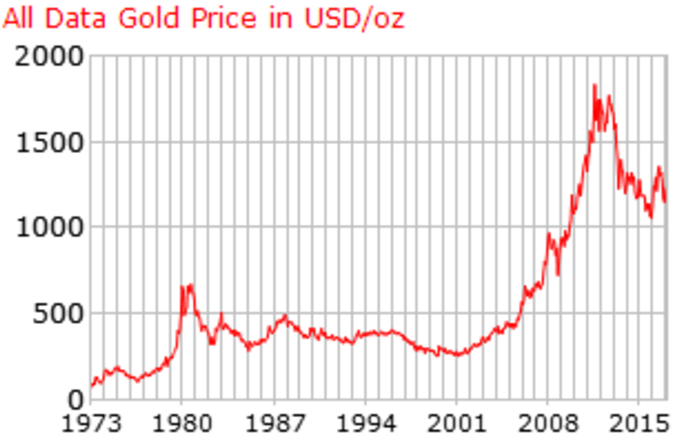
Source: Gold Price

Chart 2. Silver Prices from 1973 to 2017
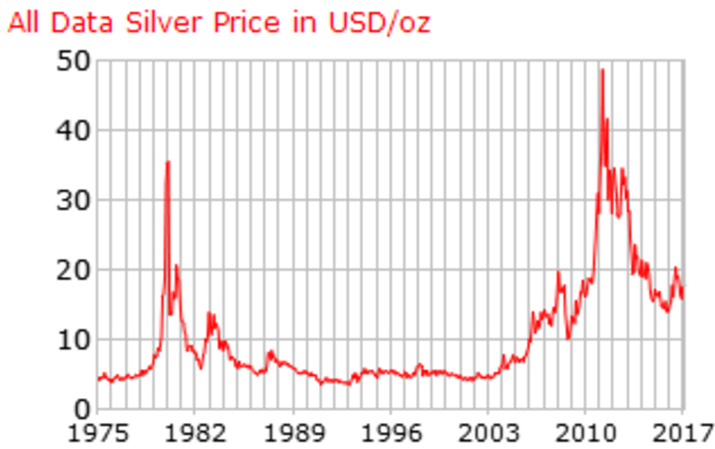
Source: Gold Price

Chart 3. Annual Inflation Rate from 1970-1979

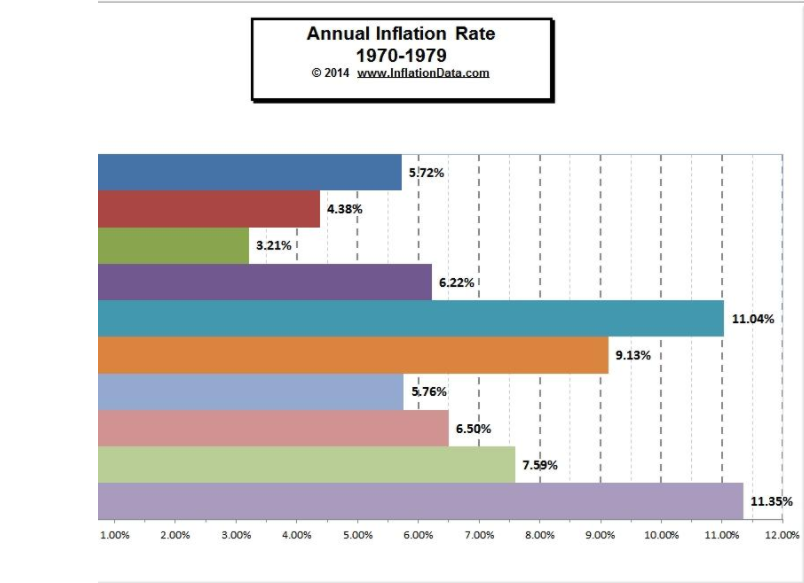
Chart 4. Annual Inflation Rate from 1980 to 1989

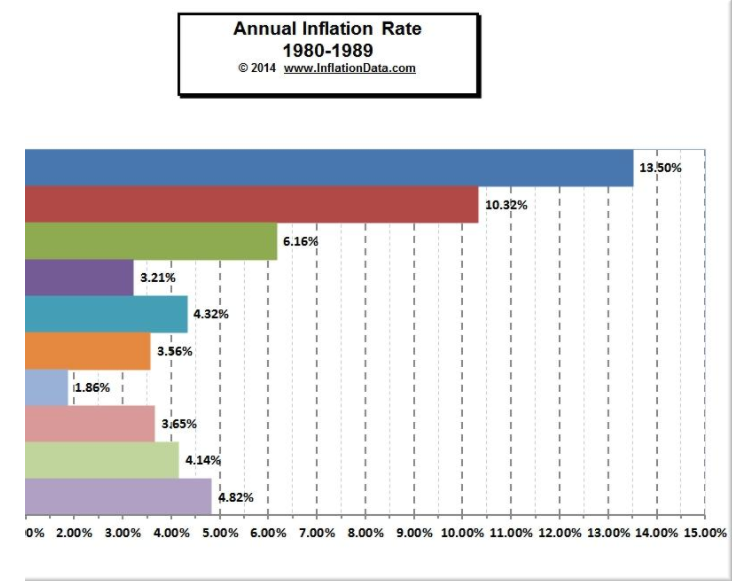
Chart 5. Federal Fund Rate from 1954 to 2017

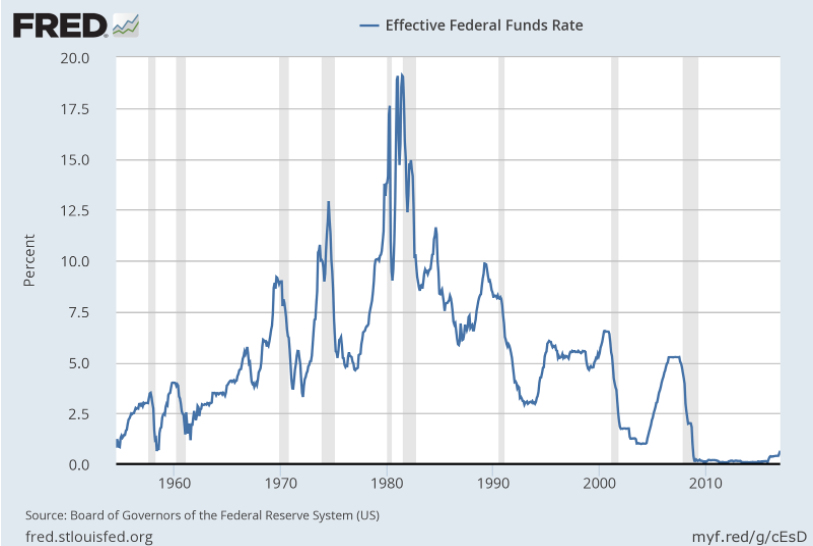
Chart 6. Annual Inflation Rate from 1990 to 2016

Monday, January 23, 2017

Trump's Year One: A Market Perspective

For article, please go to the following link:

https://www.equities.com/news/trump-year-one-s-market-perspective


Gunning Ju
A market Analyst

Monday, January 2, 2017

Trump Tariff--Obama Bull Market Terminator


Trump Tariff--Obama Bull Market Terminator

Market Parallel

In November last year, IBD published an interesting article : The Case for Trump Bull Market. The article compared current market with Reagan's Bull Market after Stagflation 1970s. To accurately interpret which stage is current bull market--starting on March 9, 2009 right after Obama went to White House,  we need to first know the macro-fundamentals behind Reagan's Bull Market.

Reagan

ObamaStock

Reaganomics

In January 1981, Ronald Reagan became US president after beating incumbent president Jimmy Carter by landslide through the following six-plank creeds of Reaganomics:

  • Reduce personal income tax rates;
  • Eliminate inflation and restore a strong dollar;
  • Downsize the government and balance the budget;
  • Deregulate key industries like energy, financial services, and transportation;
  • Expand free trade and embrace globalization;
  • Win the Cold War by rebuilding the military.
Except for failing to balance the budget, Reagan almost accomplished every agenda in his 8 year of tenure. Notably he succeeded to warm up Gorbachev to sign up Intermediate Nuclear Forces Treaty, paving the way to democratize the ex-Soviet Union and ending the Cold War.

During the past 100 years of market history, every major bull market happened in the time of peace and low inflation as Jeffrey Hirsch evidences in his masterpiece of Super Boom. By ending the Cold War and eliminating high inflation, Reagan created a benign geopolitical environment for the bull market to continue without perma bears in next 10 years. However the real catalysts to drive the Reagan bull market were free trade and tax cut, which energized USA economy.  

Laffer Curve

If tax cut happens within a country, free trade is another tax cut between countries. In 1974 Arthur Laffer created the concept of Laffer Curve which is coined by Jude Wanniski. It says for each tax revenue, there are two tax rates to achieve it; In many cases, the lower the tax rate, the high the revenue, which is counterintuitive and bothers so many policy-makers before JFK who was the pioneering president to implement tax  cut to grow economy. 


Trump

Free trade and tax cut are two key pillars of Reaganomics. Which is more crucial to the growth of economy: free trade or tax cut? 

During Clinton era, tax were raised but free trade kept, economy still grew solidly. Therefore we can at least say free trade seems to be more crucial than tax cut. So how free trade or trade tariff impacted economy and stock market? 

Smoot-Hawley Tariff

According to Jude Wanniski research, Smoot–Hawley Tariff  was the killer of 1920s bull market and major catalyst of Great Depression. Although Smoot-Hawley Tariff wasn't enacted into law until June 1930, financial markets routinely discount the impact of future events well before an action becomes effective. Economist Alan Reynolds observed the every time the tariff bill pass had a setback, the market rallied; whenever the prospects improved it fell.
========================================================================
On June 13,1930,the Senate voted , as the Times reported the following day:

Senate Passes Tariff Bill by 44 to 42; Europe Takes First Move in Reprisal;Germany and Belgium to Stop Buying Here. On this news, stock market dropped 14 points on the DJIA to 230.

On Monday, the stock market reacted to the loss of the last hope of tariff bill. The June 17 Times front page reported:

Break in Stock and Commodity Prices;Selling Swamps Exchanges; leading Issues Tumble as Wall Street Assails the New Tariff...
========================================================================

Granted, lot of other reasons contributed to 1929 market crashed and afterward Great Depression,  but monetary forces had already made the economic and financial environment very vulnerable to any shock. The Smoot-Hawley Tariff may have been the last straw, a trigger that pushed the stock market and the economy into a major downturn---as Bruce Bartlett said.

Trump Economic Plan
Trump's economic plan are:


  • Tax cut;
  • Cut Government Spending; 
  • Deregulate financial industry, etc.
  • Repeal Obamacare;
  • Adopt Trade Tariff;
  • Create Jobs;
  • Reduce debt and Seek Strong Dollar;
  • Send Illegal Immigrants Back;
  • Enhance Military capability .

Comparing Reaganomics with Trumpnomics, we can find there are lot similarities. No wonder some people think Trump will be next Reagan.

But a major difference exists: Reagan promoted free trade and initiated NAFTA which was signed into force in 1994 during Clinton Administration. Trump wants to  enact high tariff and change global free trade.

Marketwise, Reagan's bull market started after sluggish stock markets in previous decade; while Trump market begins after 8 years of Obama bull markets. Historically margin positive impact or even slight negative impact may upend bull market.In other words, any material negative catalyst may drive market players to take profit after long bull markets.
As the above evidenced, Trump Trade Tariff may highly likely hammer the US economy and send global stock market into a bear market or correction. After Reagan  8 years of bull markets, markets up 30% in 4 years during Bush Sr. Administration. Will Trump market repeat Bush Sr. market? History often repeats.

H. W. Bush

So far market seems to confuse with the fact that  Trump will adopt full-scale trade tariff . Nasdaq market showed weakness so far with high amount of institutional selling pressures, which under normal situation signifies a correction is coming.

As an old saying puts: if Santa Clause cannot call, bear will come to Broad and Wall. This time the market moved weirdly during the first 3 days of Santa Clause. maybe the markets know some painful uncertainties ahead: trade war, interest rate hiking, Brexit, elections in French and Germany, and unpredictable Trump's economic policy.

If  market behaviors badly on Tuesday and Wednesday, watch out: we don't have Santa Clause Rally this time---market often  performs worst in the first year of presidential term, especially for a new president.  

Happy New Year to All

Gunning Ju  NYC


A Market Analyst 

Reference:
1. The new American Economy( 2009)--Bruce Bartlett;
2. Clintonnomics (2009)---Jack Godwin;
3. Super Boom(2011)--Jeffrey Hirsch
4. The Reagan Years( 2000)---Darv Johnson;
5. JFK and Reagan Revolution(2016)---Lawrence Kudlow,etc;
6. The End of Prosperity(2008)--- Arthur Laffer, etc.;
7.It is the Time to Get Tough(2016)--Donald Trump;
7. The Way the World Works(1978)---Jude Wanniski.

Sunday, December 18, 2016

Market Hedge and Asset Allocation

Market Hedge and Asset Allocation

Since Trump rally began on Nov. 8,  financial stocks and infrastructure stocks had huge run.Goldman Sachs up over 30%,bank of America over 36%, among others.

This sprinter of financial stocks is totally due to Trump's promise to deregulate financial industry.
Based on Bloomberg's report, financial sector will probably engage on six reforms: capital requirement, small banks, shadow banks, stress tests, bank failure, and the Volcker rule. If president-elect Trump can be finalized as president tomorrow on electoral college vote, deregulation in financial sector will bring more risk-takers in lending and investing.

However,  the gains in financial stocks are building on hope, since deregulation will meet gigantic obstacle in Congress. In this regard, taking partial profit in the following financial stocks should be encouraged at this points: Goldman Sachs, Bank of America, Morgan Stanley,Northern Trust, J.P Morgan, etc. Also to hedge Trump's loss in electoral vote, it is prudent to trim some position in financial stocks.

Infrastructural stocks are also based on hope rather than facts. Anything in financial market based on hope is a little ahead of time, since right now nobody has faintest idea  on how to and when to start  rebuilding USA infrastructure, especially considering unpredictable Trump. The case in points: just after Trump won presidency-election, defense stocks-- Lockheed Martin and Northrop Grumman joined joyful  uptrend parade, but weeks later Trump smashed  Boeing and Lockheed Martin for high government military orders, upending those stocks run-ups.

If Trump indeed is president on Jan. 19, 2017, tech sector will possibly not have too much change as Trump said on Campaign at least during first year. Besides  last Wednesday Trump promised tech guys to serve them well. This is really confusing for Wall Street. On the other hand, Trump encouraged tech firms to back to USA by cutting their firms' tax. This is the main reason why most tech stocks have not participated recent rally without incurring meaningful pull back.Should crystal ball not appear in Trump plan next year, tech stocks would not take full relay baton to lead market until next April as usual.Some discrepancy between market perception and blurring reality exists here, providing a nice chance to profit from this market inefficiency.

Last week Fed raised federal fund rate by 25 basis points and promised another 3 raise in 2017. Market seems fully discounted this rate raise.But the market will face and figure out how the Fed to speed up rates hiking. Historically, hiking rates often happens in bull markets. When the Fed becomes hawkish, bond market and gold stocks will face headwind, while dollar  has tailwind. Do some asset re-allocation among bond, commodity and equity.

Chinese Yuan touched $0.14, devaluing  almost 6% after I said it had 7-15% devaluation room last year. But some market players predicted one US$ will be worth 7.4 Yuan. It may happen, but not guarantee. At this point, to my views, China's central bankers don't need to rush to defend its currency fall. Historically,  the price of financial vehicle seldom goes straight up to the sky from very bottom.


Gunning Ju

Market Analyst

From NYC


Sunday, November 20, 2016

Will 2016 Parallel 2012?: Trump's win Surprised the Market

Will 2016 Parallel 2012?: Trump's win Surprised the Market: Trump's Win Surprised the Market Nov. 8's Trump win surprised the world and market. After initial panic in overnight futures mark...

Trump's win Surprised the Market

Trump's Win Surprised the Market

Nov. 8's Trump win surprised the world and market. After initial panic in overnight futures market, the USA market rebounded forcibly, leading by infrastructure and financial sectors, while FANGs ( Facebook, Amazon, Netflix, Google) and other tech stocks dropped without participating this Trump rally.

Before election, almost all pollsters predicted Clinton's win. Trump won electoral votes 290 over   Clinton's 232 while Clinton won popular votes 63 million vs. Trump 61.5 million by nearly 1.5 million votes. Most market watchers were wrong on election, but some very few were right:Jeffery Gundlach, Martin Armstrong, Sam Stoval, Jeffery Hirsch, and my friend Jone and Charles at Queens Flushing Library.

In fact, according to Sam Stovall's research, if S&P500 fell between August and October, historically, incumbent party will 83% likely lose election. This year from the end of July to the end of October, S&P500 dipped 2%, which again validated Stovall's findings.

Regarding two presidential candidates, I think that Mrs. Clinton is more qualified than Mr. Trump, consistent with the fact that more people in USA voted for Mrs. Clinton. Since 2000, I had been right on presidential election every time based on presidential debates, candidate's experience and demestic and international knowledge plus education background. This time I am wrong, even though Mrs. Clinton won 3 presidential debates by huge margin.  So why nearly all mainstream media were wrong on this election? As my friend Jone Bell puts, this is a revolution and a fight between social media and mainstream media with former winning out.

If social media won election and can impact other person's political views, we can believe that mainstream media will still have far more impacts on the financial markets than social media. This is because more informative people still regard mainstream media holds more power than social media in financial markets.

Back to the market, this Trump rally lacks FANG's participation and may send some signal for the market weakness ahead. But short-term market uptrend still has leg for two main reasons: 1. Market sentiment still not so hype; 2. Bullish market seasons--S&P500 sending bullish signal on Nov 7. right before election day, which may say that regardless of who wins presidential election, it is the time to be long the equity market.

Happy Thanksgiving Day to All.

Gunning Ju

A market analyst from New York

Saturday, October 8, 2016